
A survey about crime in South Africa conducted by Statistics South Africa focusing on crime stats sa has listed the crimes which South Africans are most afraid to fall victim to in the country.
The [Victims of Crime Survey for 2014/2015] looked at home security in private households from all nine provinces in South Africa, and provides information about the dynamics [rather than the causes of crime in South Africa] of crime from the perspective of these households and victims of crime. As part of the survey, households and individuals were asked about violence in South Africa, which crimes they believe are the most common – and which crimes they are most afraid of becoming victims of in the country.
Looking at the crime data released by the SAPS in September 2015 for the reporting period 1 April 2014 to 31 March 2015, the most common reported crime in the country – excluding drug related crime – is house robbery and burglary at residential premises, which saw just under 254,000 cases open in 2014/15. The survey data shows that South Africans at large are apparently well aware of this, as most citizens accurately perceived this to be the most common crime in South Africa.
More than six in every 10 households (65.9%) perceived the most common crime to be housebreaking/burglary, followed by house robbery (42.7%), street robbery (42.1%) and pick-pocketing or bag-snatching (26.0%).
When it comes to crimes most feared, however, things look slightly different. While housebreaking/burglary and home robbery [ie robbery when the occupants are at home] and street robbery were perceived to be the most feared crimes, the actual fear of murder and sexual assault also feature highly.
Crimes Most Feared
Ranking Crime Feared
1 Housebreaking / Burglary – 63.6%
2 Home Robbery – 49.8%
3 Street Robbery – 43.2%
4 Murder – 37.6%
5 Sexual Assault – 30.7%
6 Pick-pocketing / Bag-snatching – 26.4%
7 Assault – 25.0%
8 Business Robbery – 17.5%
9 Vehicle Hijacking – 16.8%
10 Livestock / Poultry Theft – 16.5%
[Source: Statistics South Africa]
Crime Statistics 2005/2006 – 2014/2015
The official S.A. Police Crime statistics for crime in South Africa for the period 2014/2015 shows that the listed most feared crimes are indeed a huge concern. It is important to look at the crime rate in South Africa over a longer period of time. Often one tends to compare the current crime stats with the previous year and when there is a decline in a specific category, one gets excited and see it as an improvement.
There are many factors that one must take into consideration when evaluating crime statistics, which include the economic climate, social issues in South Africa, unemployment, political climate, social cohesion and the ability by law enforcement agencies and the judicial system to deal with crime in South Africa.
Conviction success rates are a contentious issue in and various analysts and publications reporting on conviction rates use different methods to calculate success rates. The National Prosecuting Authority defines a conviction rate as the percentage of cases finalised with a guilty verdict divided by the number of cases finalised with a verdict. [Researched by Julian Rademeyer and first published by Africa Check on 12 April 2013]. Some argue that the total guilty convictions should be divided by the total number of cases reported to the police or divided by the number of cases placed before the NPA for decision. When applying these three different equations there is a huge difference in “successful conviction rates”.
To produce a report on crime statistics in South Africa is like travelling a pothole ridden road. It is sometimes seen as the clash of the intellectuals as ever more views from experts, commentators and the media run up against each other.
Crime statistics are seen as the “official figures” whereby the government and society are measured by. It gives us an indication of the social evil we face and about the ability of the government and public services to contain it and the causes of crime in South Africa.
For that reason, there is no magic formula and a given is that crime statistics are based on cases reported and cases registered as a result of police action.
Crimes committed but not reported or detected are obviously not included and there are varied opinions on what that figure might be. Government, civil society and the public at large make decisions based on “accurate” crime stats which has a huge impact at various levels. They impact on broader government and social policy to decisions we make as individuals on where we live, home security, where we go out to, safety at home or where we allow our children to play.
In South Africa official crime statistics are categorised as;
- Contact Crimes (Crimes against the person)
- Murder
- Sexual offences
- Attempted murder
- Assault with the intent to inflict grievous bodily harm
- Common assault
- Common Robbery
- Robbery with aggravating circumstances
- Contact Related Crimes
- Arson
- Malicious damage to property
- Property Related Crimes
- Burglary at non-residential premises
- Burglary at residential premises
- Theft of motor vehicle and motorcycle
- Theft out of or from motor vehicle
- Stock theft
- Crimes Detected as a Result of Police Action
- Illegal possession of firearms and ammunition
- Drug related crime
- Driving under the influence of alcohol or drugs
- Sexual offences detected as a result of police action
- Other Serious Crimes
- All theft not mentioned elsewhere
- Commercial crime
- Shoplifting
- Subcategories of Aggravated Robbery
- Carjacking
- Truck hijacking
- Robbery of cash in transit
- Bank Robbery
- Robbery at residential premises
- Robbery at non-residential premises
The following graphs illustrate the rates of crime in South Africa over the last ten reported crime stats periods, namely 2005/2006 to 2014/2015.
The focus is on the Top 5 most feared crimes in South Africa.
Housebreaking / Burglary – 63.6%
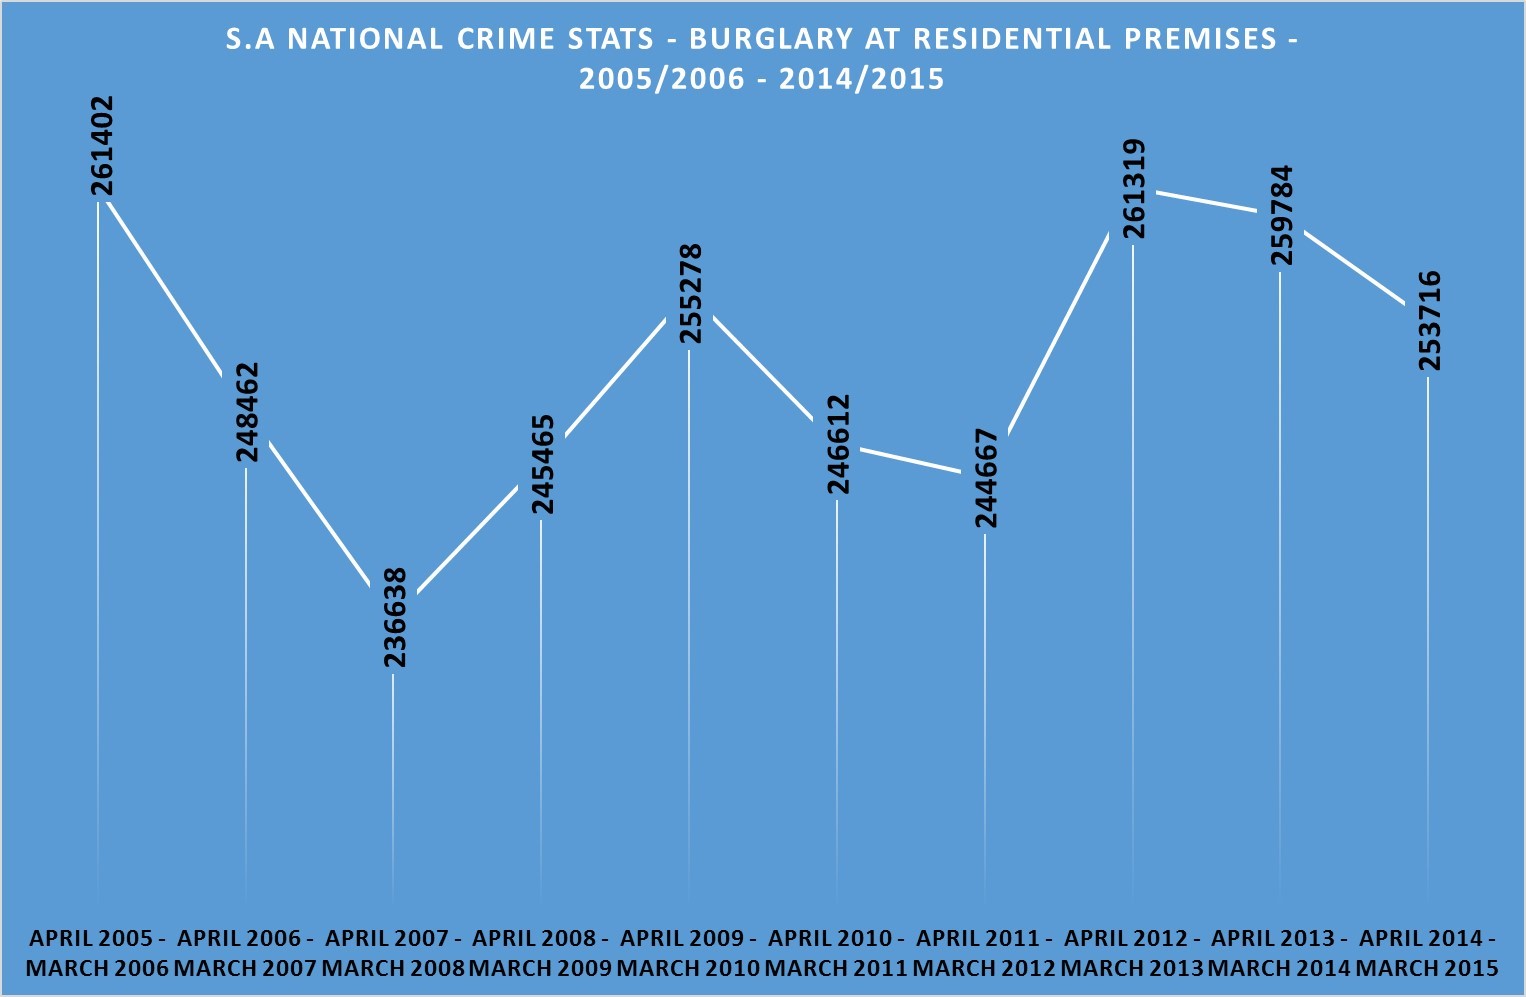
Though not surpassing the 2005/2006 figure of 261402 reported cases in 2005/2006 (2.94% decrease) the figures are still alarmingly high with a ratio of 461 per 100 000 people for the period 2014/2015 and 695.11 burglaries per day
House Robbery – 49.8%
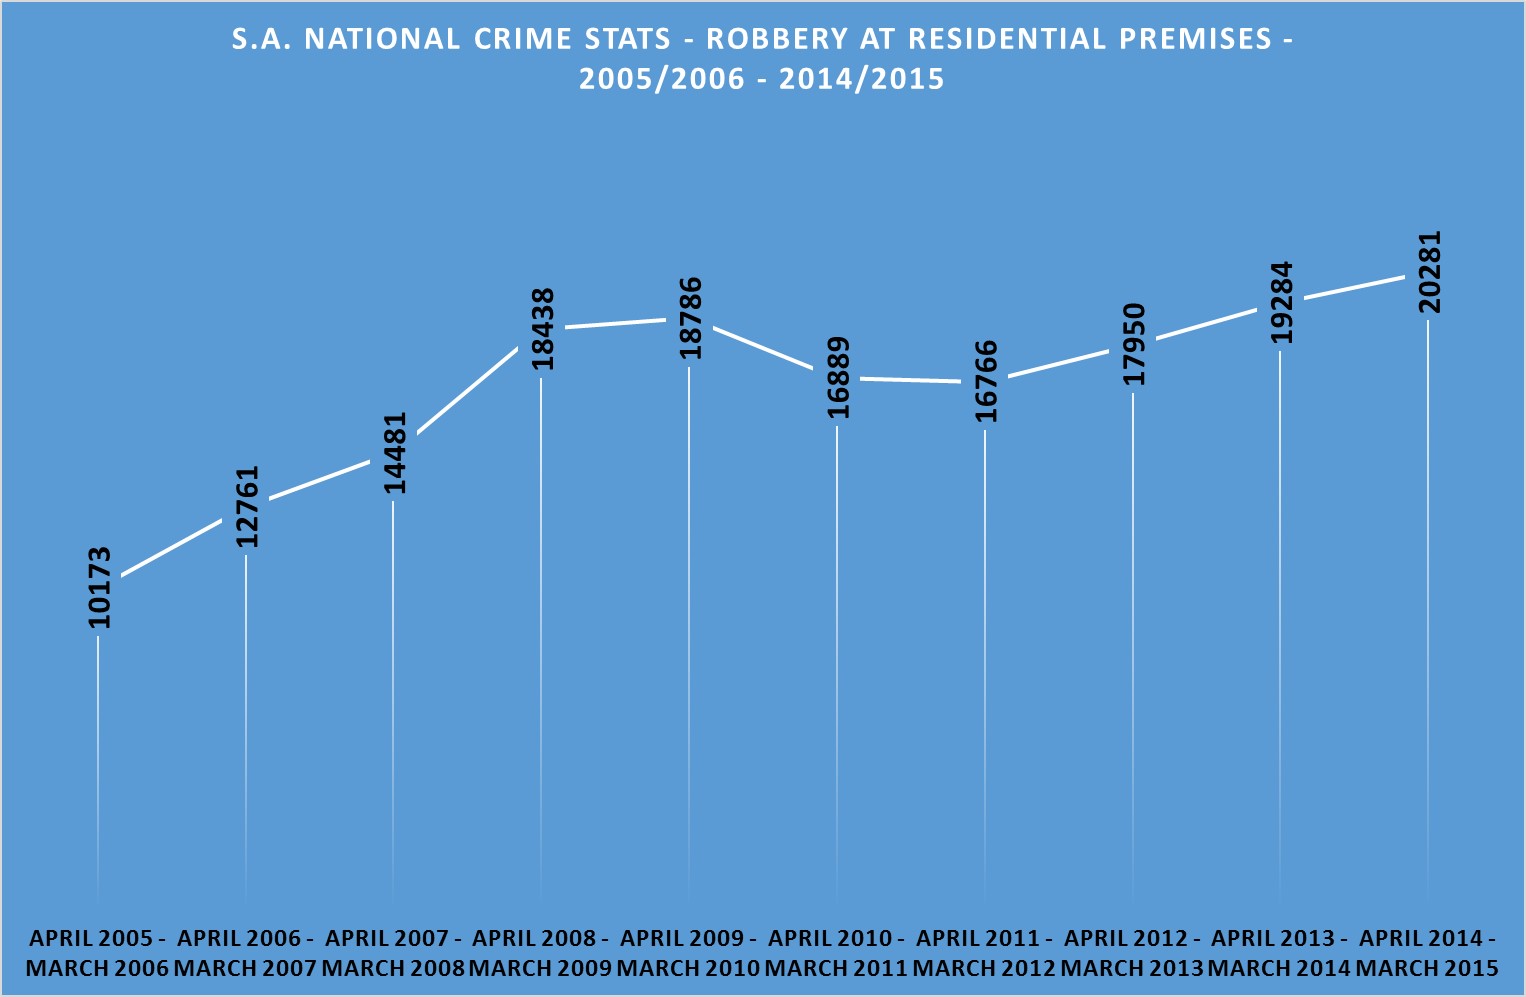
An extremely alarming increase in home invasion while the occupants are at home of 99.36% since 2005/2006 with a ratio of 36 per 100 000 people for the period 2014/2015 and 55.56 robberies at residential premises per day
Street Robbery – 43.2%
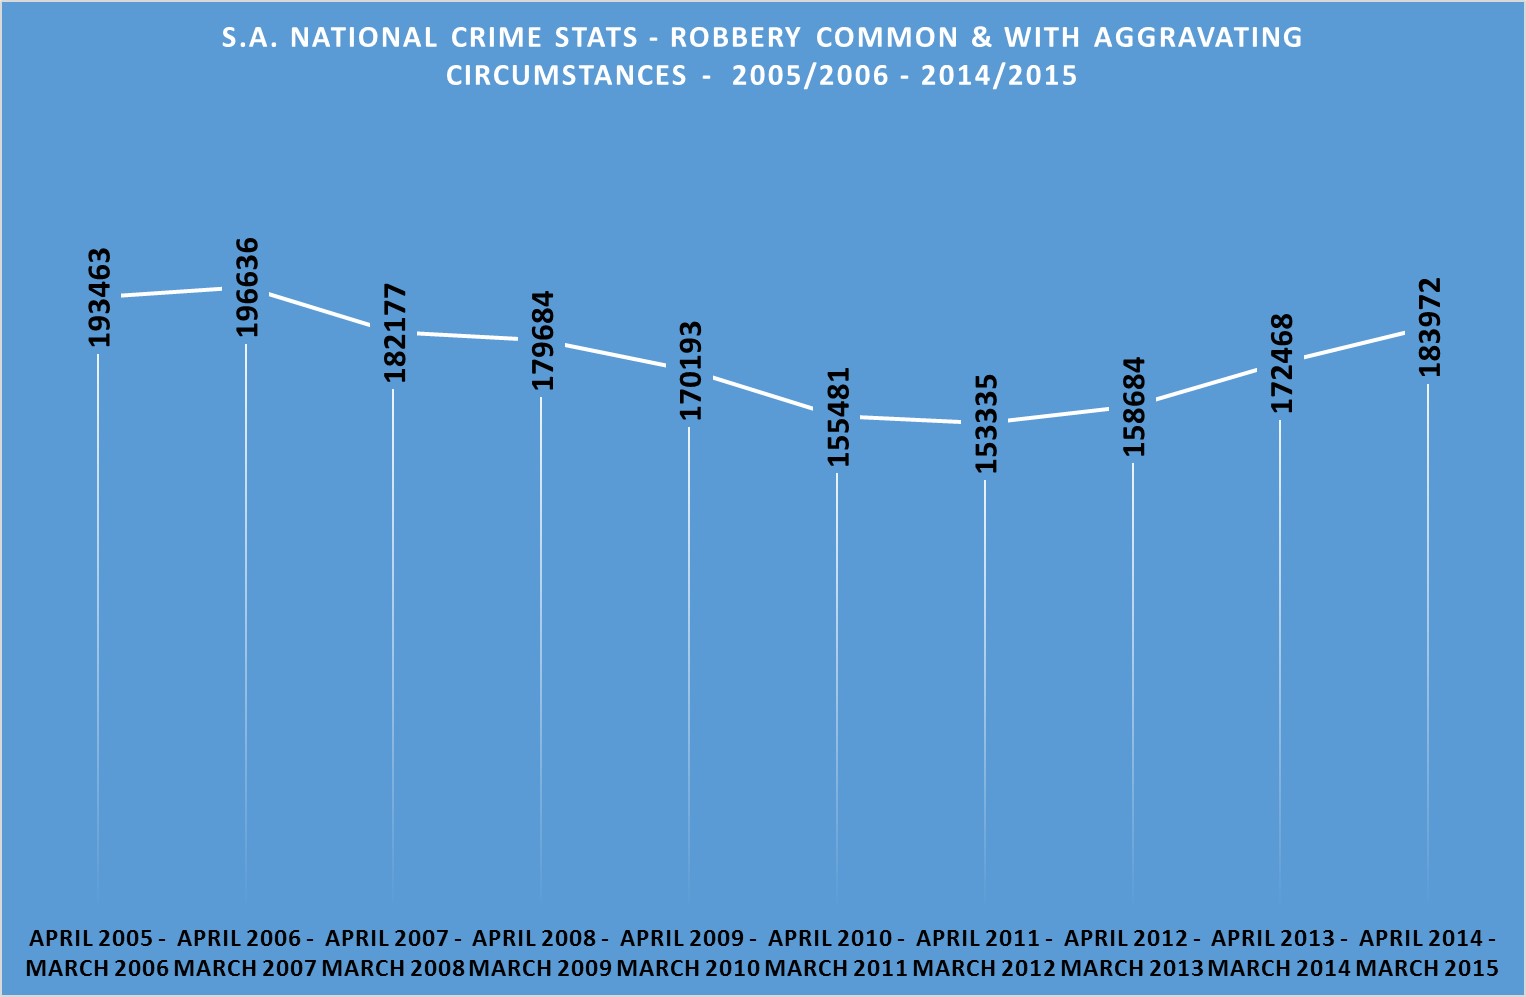
A decrease of 4.91% in 2014/2015 compared with 2005/2006 with a ratio of 334 per 100 000 population and 504.03 robberies per day
Murder – 37.6%
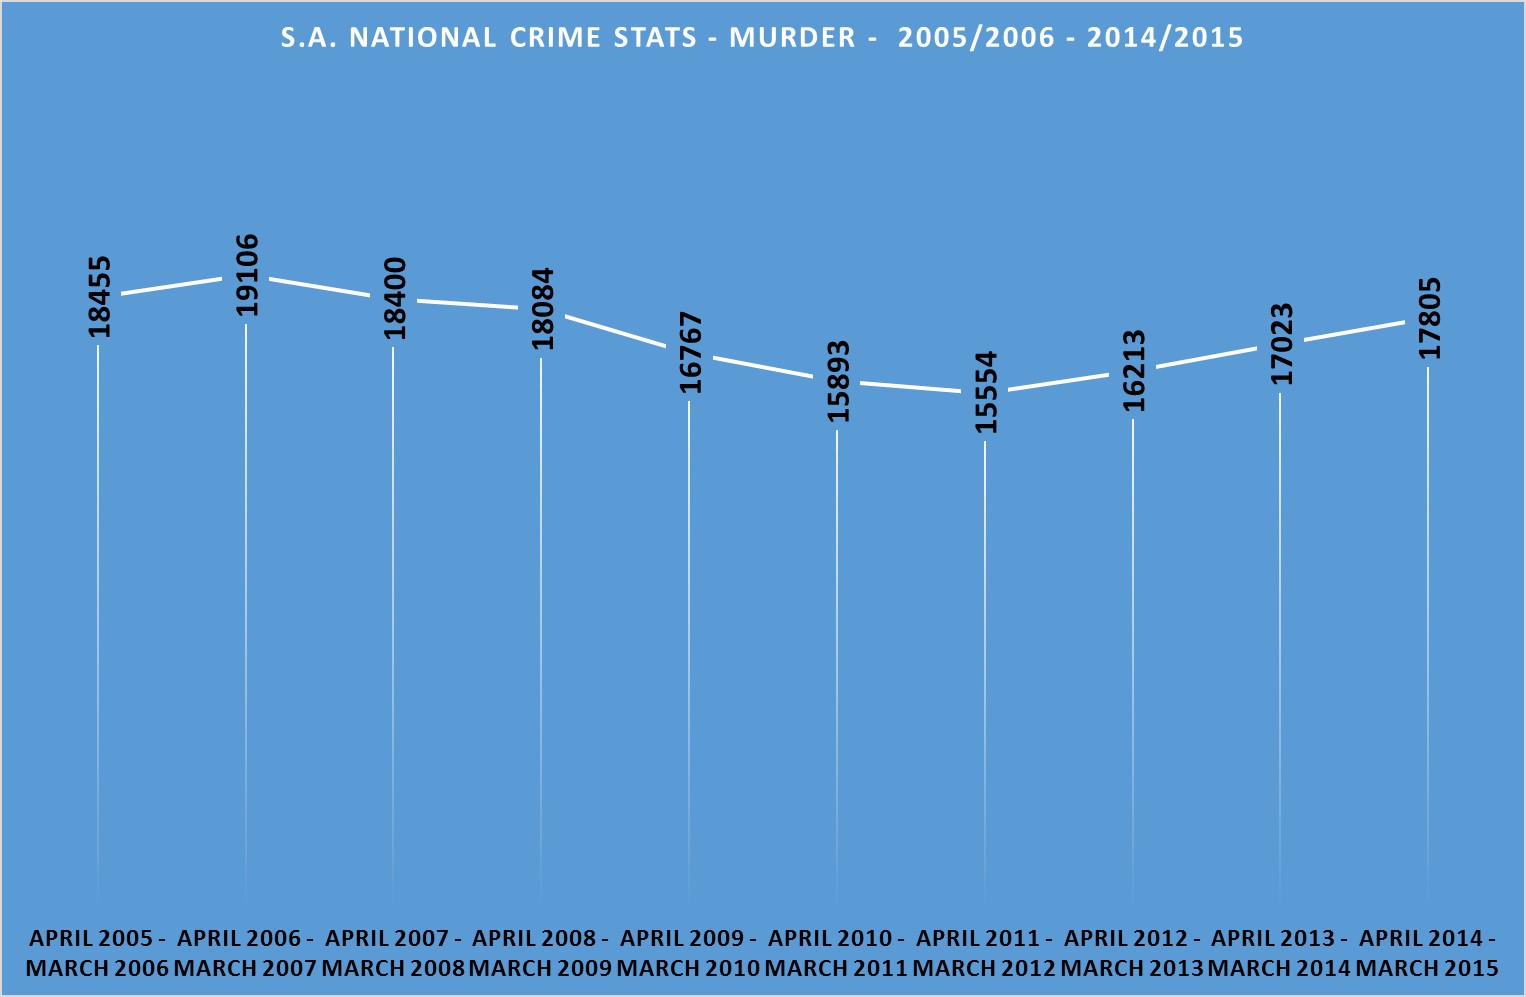
A decrease of 3.52% in 2014/2015 compared with 2005/2006 with a ratio of 32 per 100 000 population and a staggering 47.78 murders per day
Sexual Assault – 30.7%
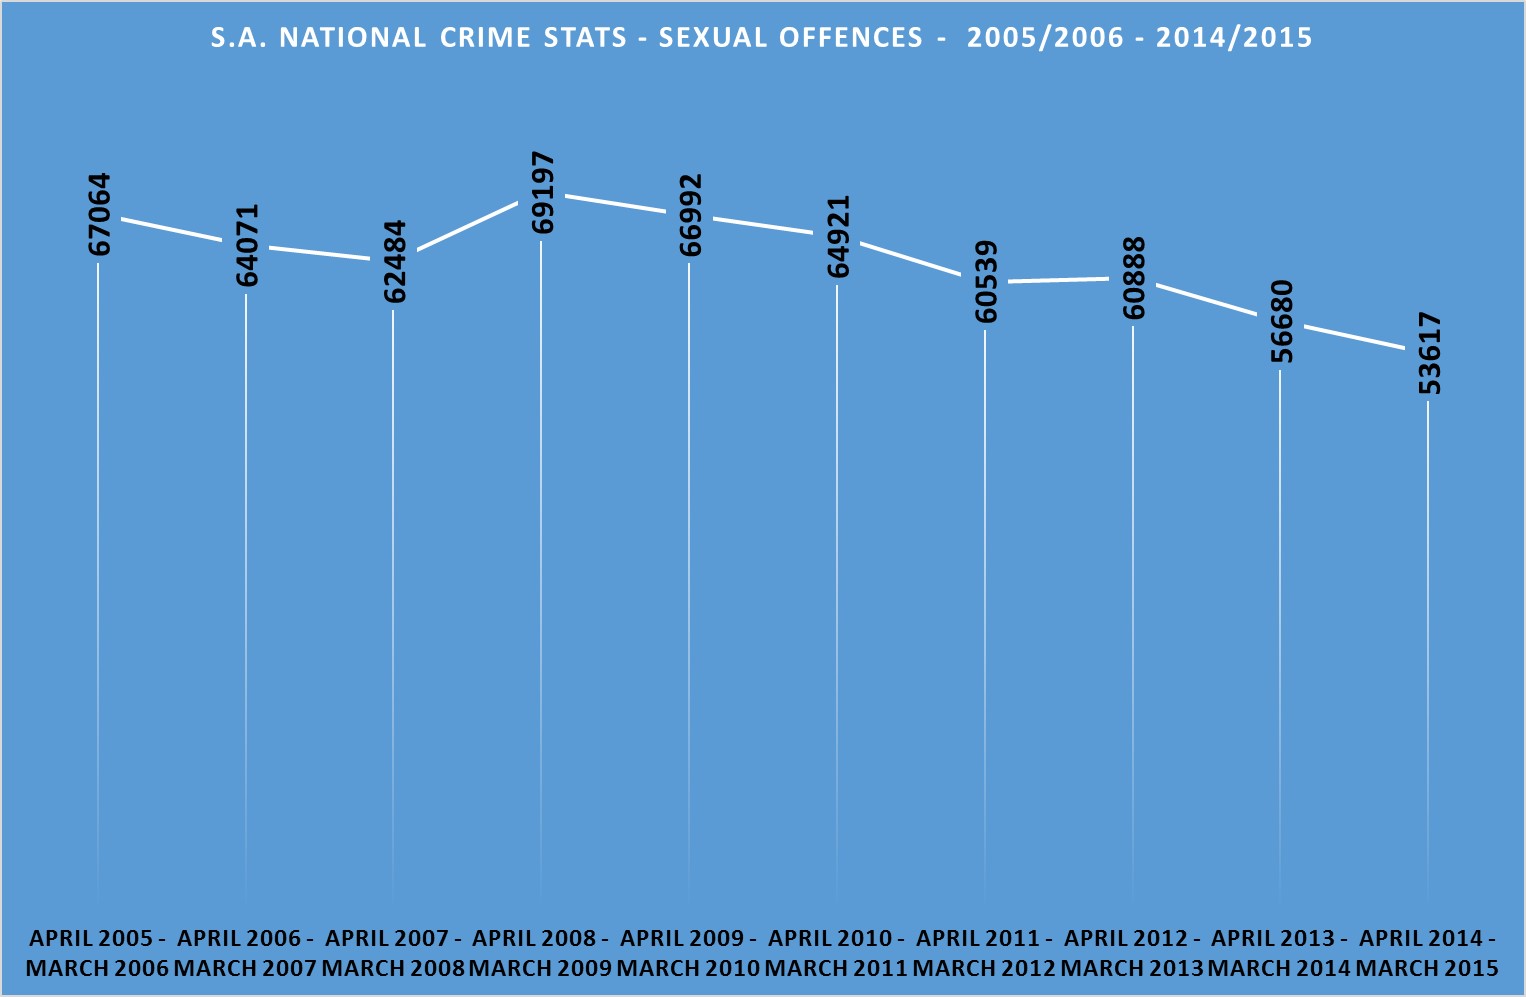
A decrease of 20.05% in 2014/2015 compared with 2005/2006 with a ratio of 97.47 per 100 000 population and 146.86 sexual offences per day
[Population estimate for 2014/2015 rounded of to 55 million]
An International Perspective
There are various sources reflecting international crime statistics and making comparisons based on numerous criteria of which crime per 100 000 population seems to be the most common. Comparing crime internationally is however very problematic due to the reporting rates and periods of crime, the accuracy of such reporting and how crime is defined and categorised in different countries.
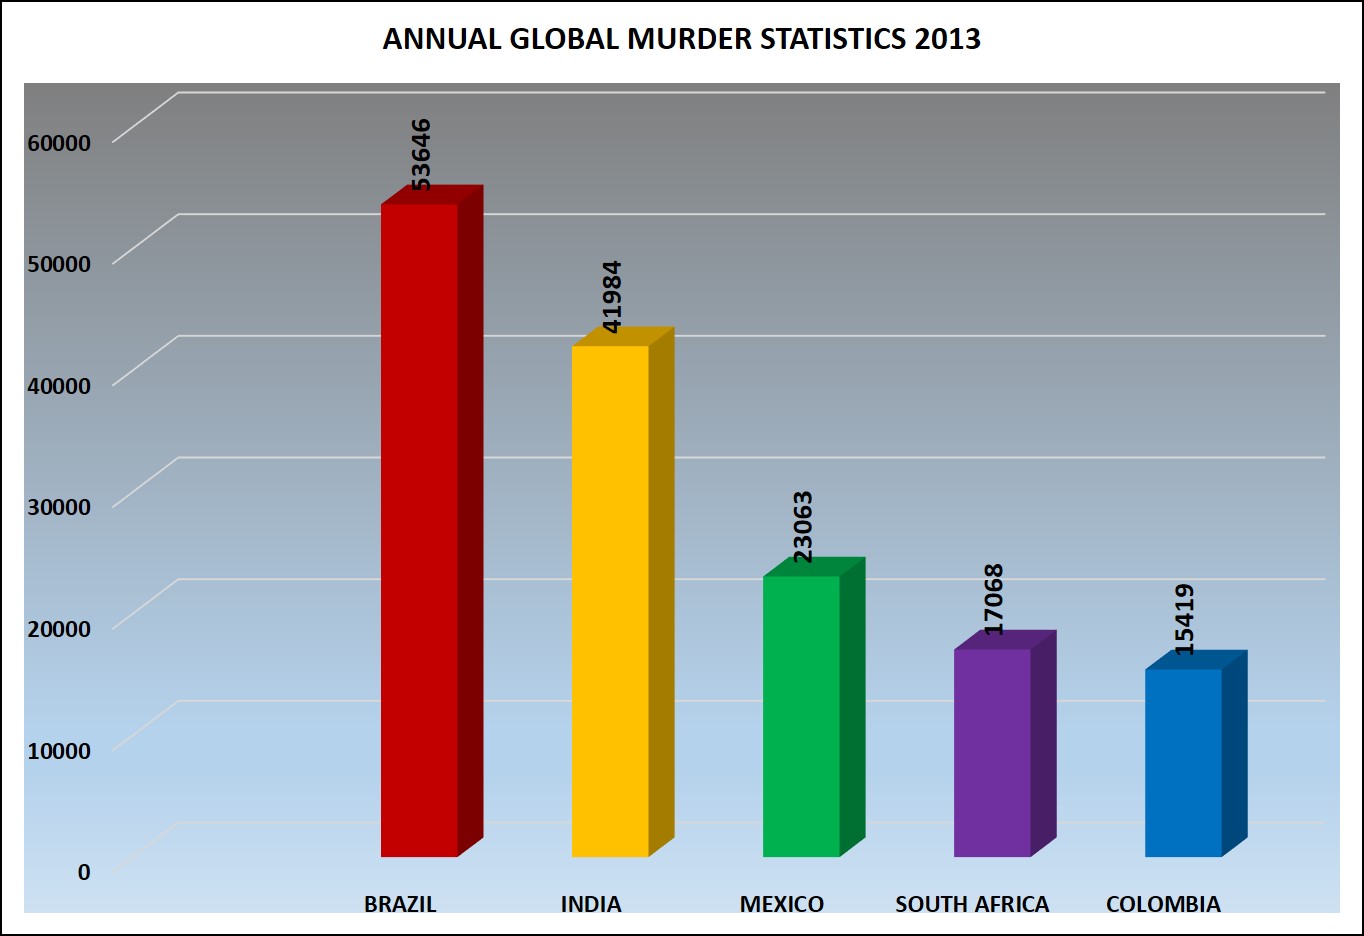
In 2013, on murder and housebreaking/burglary crime figures alone:
- South Africa (Population- 52 980 000) was ranked the 4th highest in total number of murders (16213) and 1st in per 100 000 population (30.64) behind
- Brazil (53646 murders – population – 199 321 000 – 26.91 per 100 000 population)),
- India (41984 murders – population 1 260 000 000 – 3.3 per 100 000 population) and
- Mexico (23063 murders – population 117 410 000 – 19.64 per 100 000 population).
- South Africa was ranked the 2nd highest in total number of housebreaking/burglary (261 319) and 1st per 100 000 population (493 per 100 000 population) in the world behind the United States (1 425 700 – population 316 427 395 – 450 per 100 000 population).
It is therefore not surprising that South Africa is referred to as the Murder Capital of the world.

Accountability
It is in the interest of civil society that government, local government and public figures are kept accountable. The release of crime statistics is currently done in arrears which makes advanced planning very difficult.
Imagine the following scenario
“All police stations in South Africa capture and update their crime stats daily and by the next morning it is verified by the station commander and/or designated official and uploaded into a cloud environment. The data is then accessed and verified by the provincial commissioner’s offices within 24 hours and designated head office personnel does final verification within 48 hours of the upload. The statistics are then released online within 72 hours after being captured”
Given the technology available on the market this should be a walk in the park. All that is required is the will to do it. By doing this we will become pro-active and be a step ahead of the criminals by doing proper planning based on current data and not historical statistics.
It is important for everyone to rally behind our law enforcement agencies and their crime fighting initiatives. Through community based structures and forums we as ordinary citizens can make meaningful contributions in preventing and combatting crime and violence in South Africa.
A note about the author: Hein Crocker was a Lieutenant in the South African Police and has also spent a number of years in the Security Industry. He is currently the Managing Director of SQAS-SA, a consulting and training service provider to the commercial fleet industry. Hein has an absolute passion for crime prevention and community service and is also the chairman of Afriforum in Oudtshoorn.
Links: www.sqas-sa.co.za
Further reading:
Understanding & Preventing House Burglary
10 Home Security Tips to Keep Your Home Safe
5 Strategies to Help Keep Your Family Safe During a Home Invasion